Announcing Struct v0.6: Accurate PnL, Down to the Block
v0.6 rebuilds Struct's PnL from the ground up. Exactly what a trader has made or lost on Polymarket, updated every block, counting every fee, rebate, reward, and yield payment.
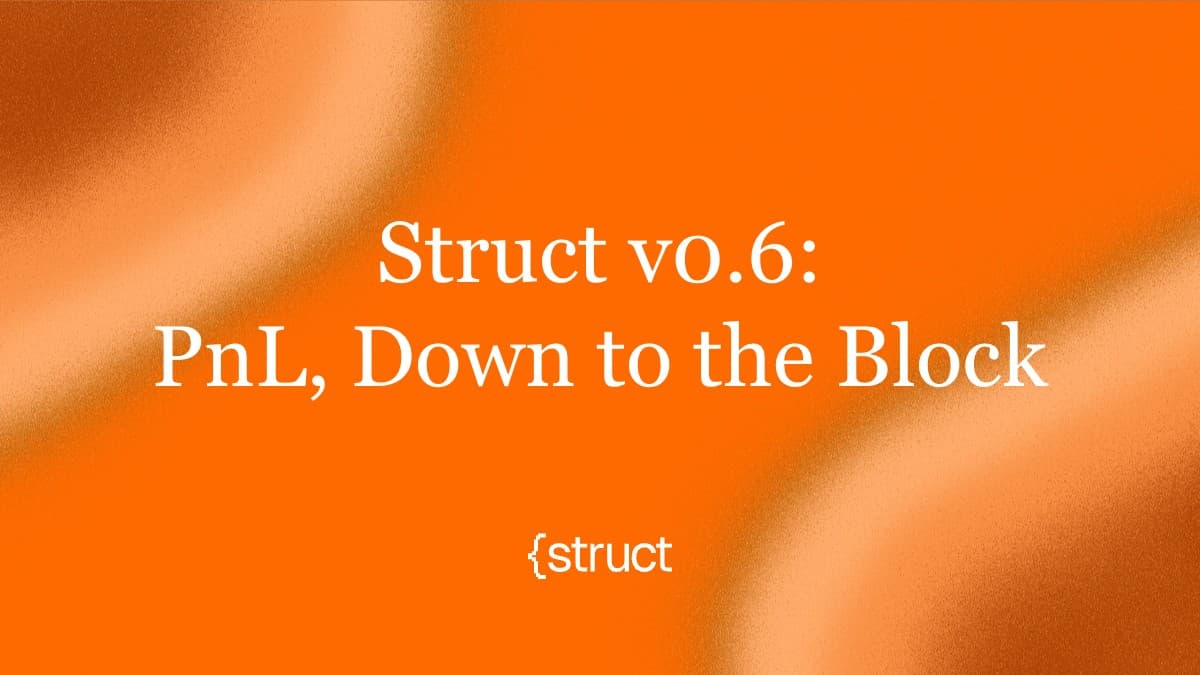
Struct now tells you exactly what a trader has made or lost on Polymarket. Down to the block. Including every fee, rebate, reward, and yield payment.
v0.6 is a complete rebuild of how we calculate, store, and serve PnL. It touches every surface that exposes it: the REST API, the Explorer, leaderboards, holder snapshots, and position breakdowns.
Polymarket's own UI shows a live PnL number that moves with the market, but it stops there. It doesn't count fees paid, rebates earned, rewards, or yield. Until today, ours didn't even move with the market. v3 fixes both: live like Polymarket's, and then complete in a way no other provider offers.
Here's what changed and why it matters.
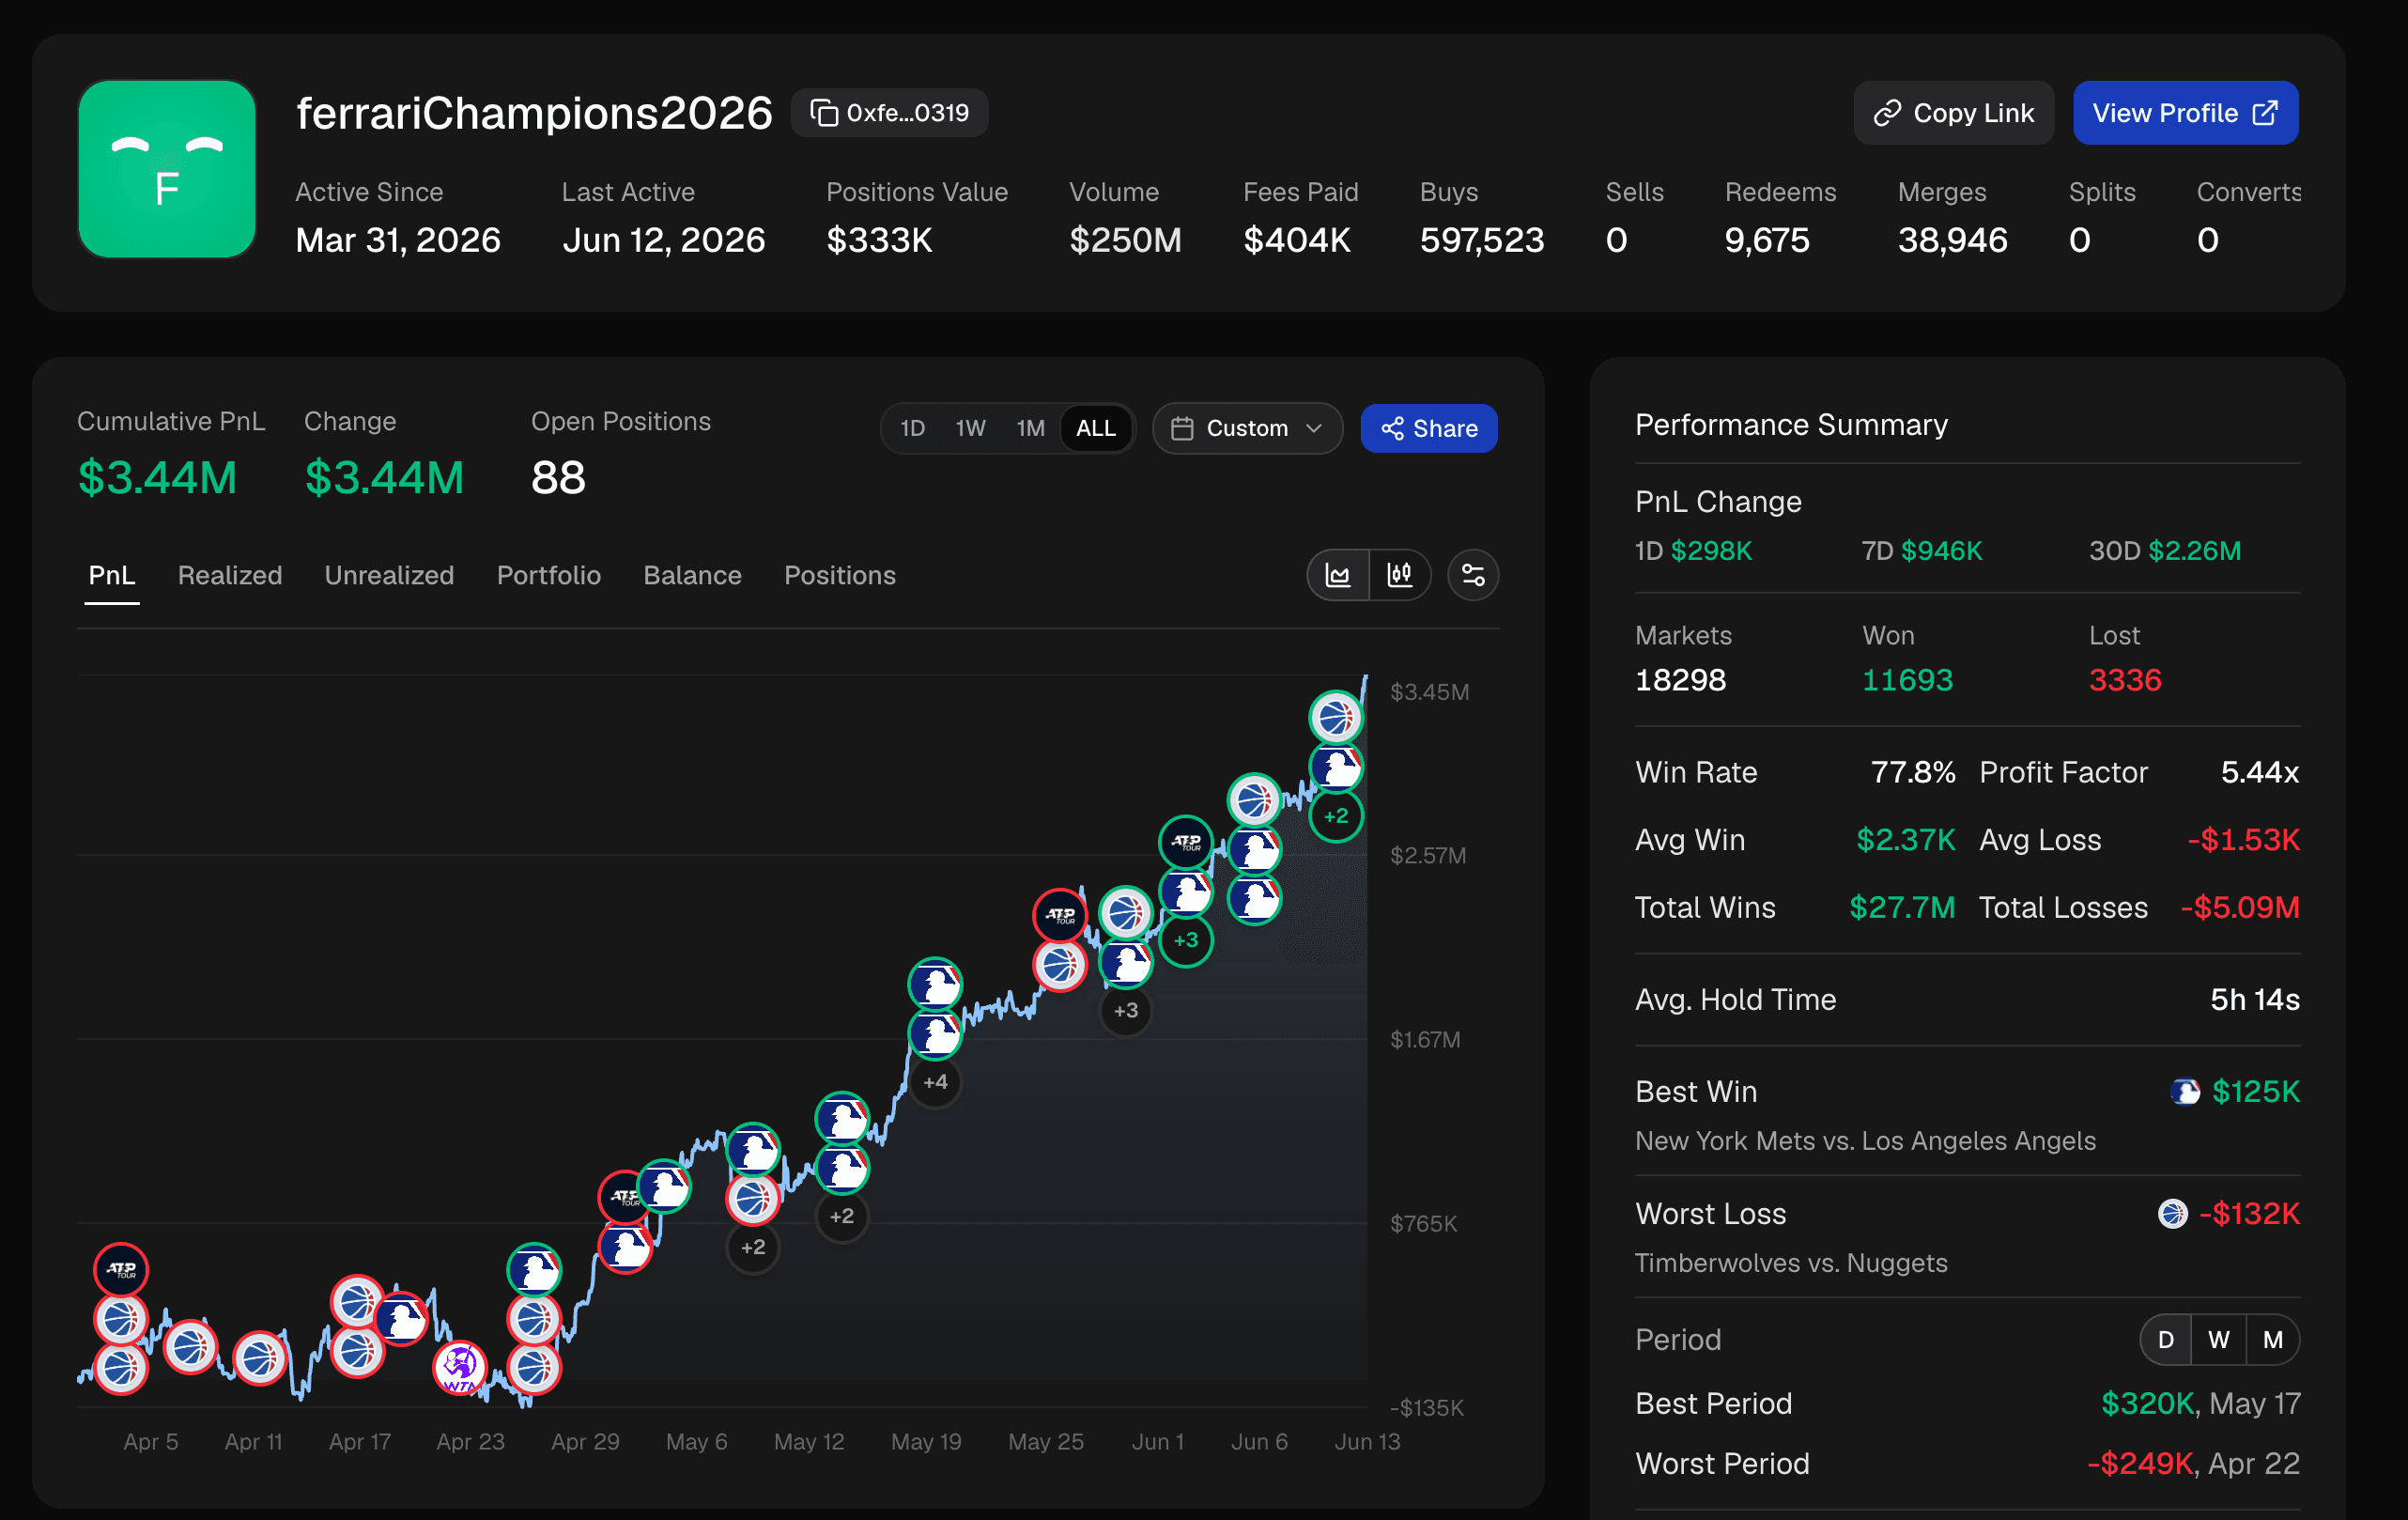
See this trader live on Struct Explorer →
v3 is a drop-in update. Every existing v2 PnL endpoint is automatically upgraded. Same routes, same response shape, no fields removed. v3 only adds new fields on top. If you're already integrated, your code keeps working and you get the improved calculation for free.
What was wrong with v2 PnL
Our v2 PnL was cost-basis. When you spent $100 buying into a position, PnL started at -$100. It only recovered when you sold or redeemed. If you were up $40 on paper and hadn't exited yet, the API said you were down $100.
That model makes some sense for liquid equity markets where positions turn over quickly. It makes almost no sense for prediction markets.
Polymarket is a hold-to-resolution venue. Most traders open a position and sit on it for weeks or months while the underlying event unfolds. Under cost-basis accounting, every active position looks like a loss for its entire lifetime. Leaderboards rank traders who happened to resolve recently over traders with better open positions. PnL charts were trending down until a sell or market resolution.
It misrepresents how traders actually perform, and it didn't match what Polymarket itself was showing in its own UI.
How v3 works
PnL v3 switches to mark-to-market accounting, calculated at the block level.
The formula is simple: current market value of your shares minus what you paid for them. The moment you buy $100 into a position, your PnL is $0. If those shares are now worth $105, your PnL is +$5. No sell required. No resolution required. The number reflects reality as it exists on-chain right now.
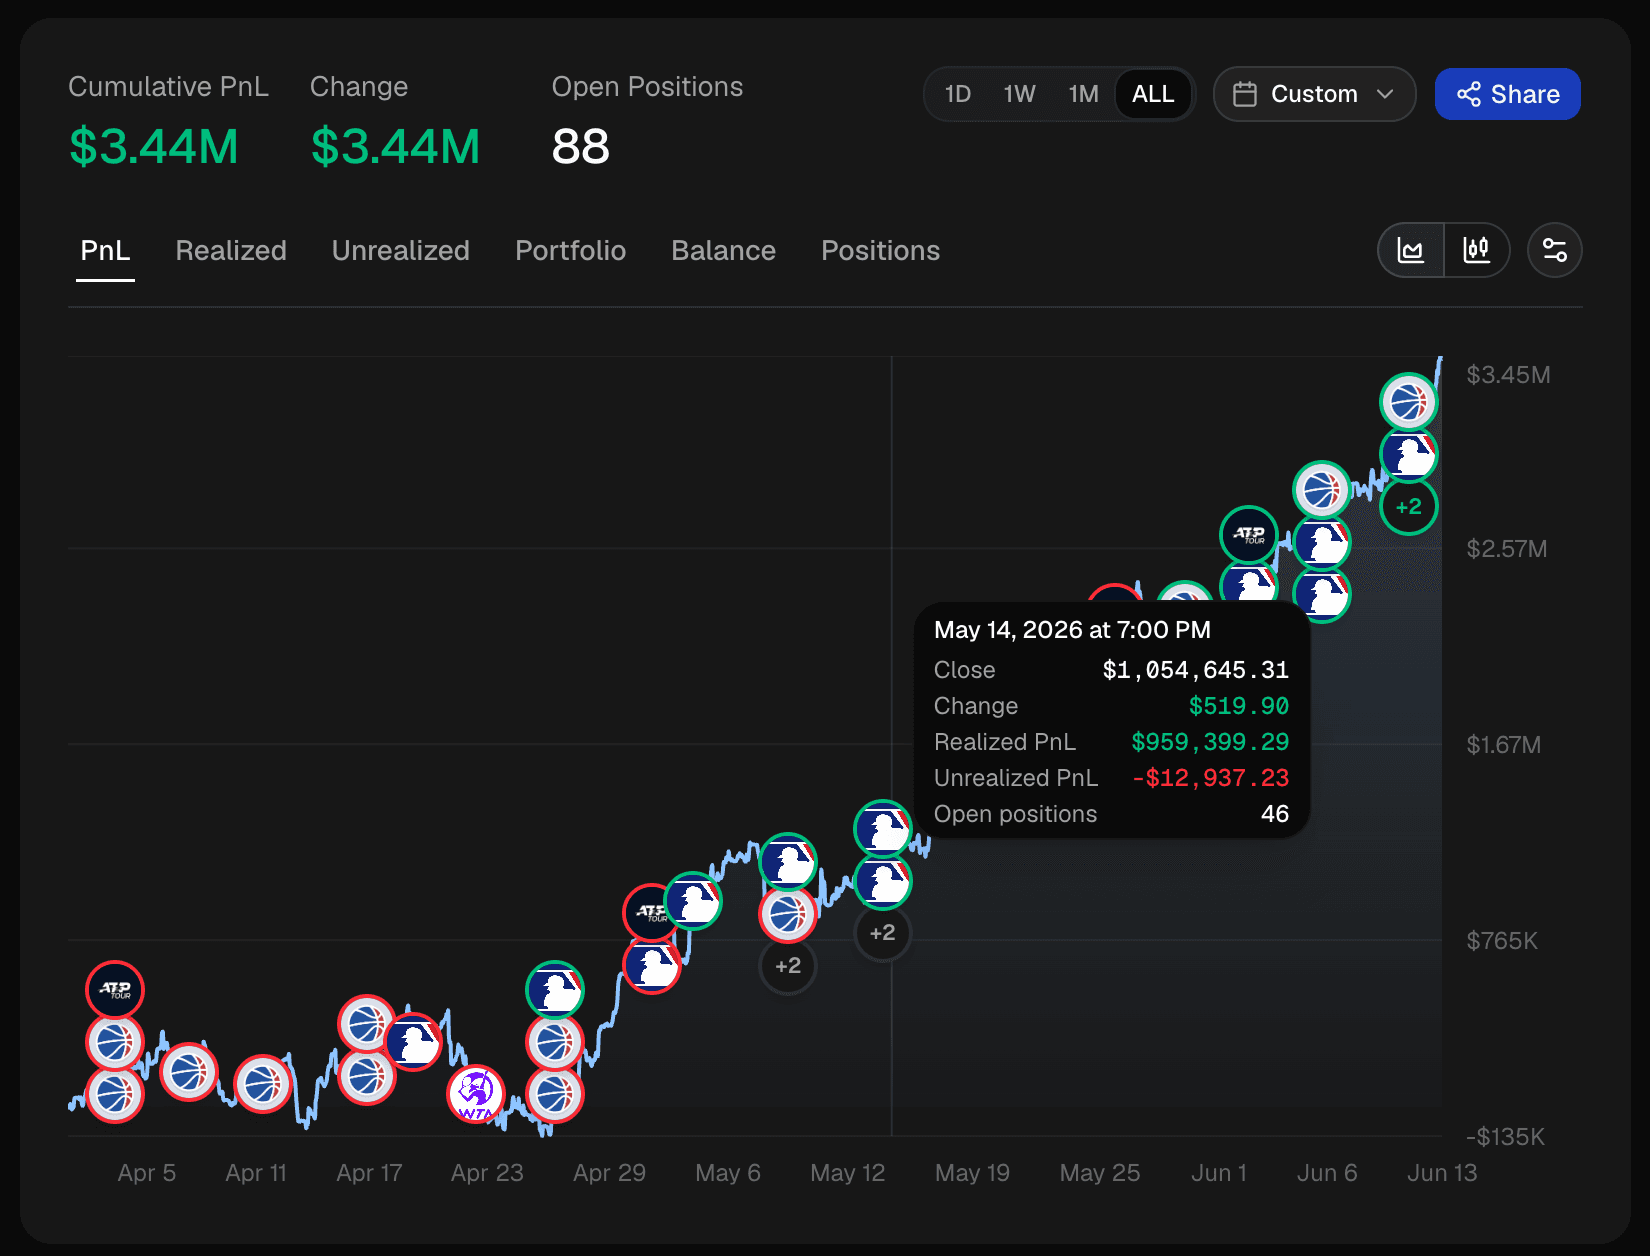
Open this PnL chart on Struct Explorer →
Realized and unrealized PnL are tracked separately. Realized settles on every sell, merge, or redemption. Unrealized updates with every block. The sum is your true position.
A few things this unlocks that weren't possible before:
- Accurate leaderboards. Rankings now reflect who is actually winning, not who has cashed out most recently. A trader sitting on a large unrealized gain ranks where they should.
- Meaningful PnL charts. Time-series data now moves with price. You can chart a trader's performance over their lifetime and see it respond to market events, not just to their exit timing.
- Per-market and per-position granularity. v3 breaks down PnL at every level of the hierarchy: category, event, market, and individual position. You can see exactly where a trader made or lost money, not just their aggregate.
Where v3 goes further than Polymarket's PnL
Polymarket's UI shows mark-to-market PnL. v3 matches it conceptually, then pushes past it on the things that matter for serious integrations:
- Block-level updates. v3 PnL recomputes on every block, not on a polling interval. Bot operators, market makers, and dashboards see position value move in step with on-chain state.
- Lower latency. Because we recompute at the block, the number you read from the API is current as of the latest block we've indexed, not minutes behind.
- Merges, splits, and conversions, accounted properly. Splitting collateral into YES + NO, merging YES + NO back into collateral, and neg-risk conversions all reshape a position's cost basis without being a buy or a sell. v3 handles each of these as a first-class event, so the cost basis it uses to compute PnL stays correct through any sequence of on-chain operations. v2 (and most third-party trackers) treat these as gaps and silently drift.
- Yield, fees, rebates, and rewards, all in the number. Polymarket's own PnL does not include any of these. v3 folds yield, fees paid, rebates earned, and rewards into the same PnL calculation. The figure you read isn't just price-times-shares minus cost; it's the actual economic outcome of holding a position on Polymarket, including everything the protocol pays you and everything it charges you. For a market maker or LP, the difference can be the entire story.
- Drill-down at every level. Category, event, market, and individual position breakdowns from one API. Polymarket's UI shows aggregates per trader; v3 lets you slice the same trader's PnL across any axis.
What's in the v3 API
Twenty new REST endpoints across three namespaces, a new WebSocket room, and a fully updated TypeScript SDK.
Trader PnL
The core namespace. Every endpoint is keyed by wallet address and exposes a different lens on the same underlying ledger.
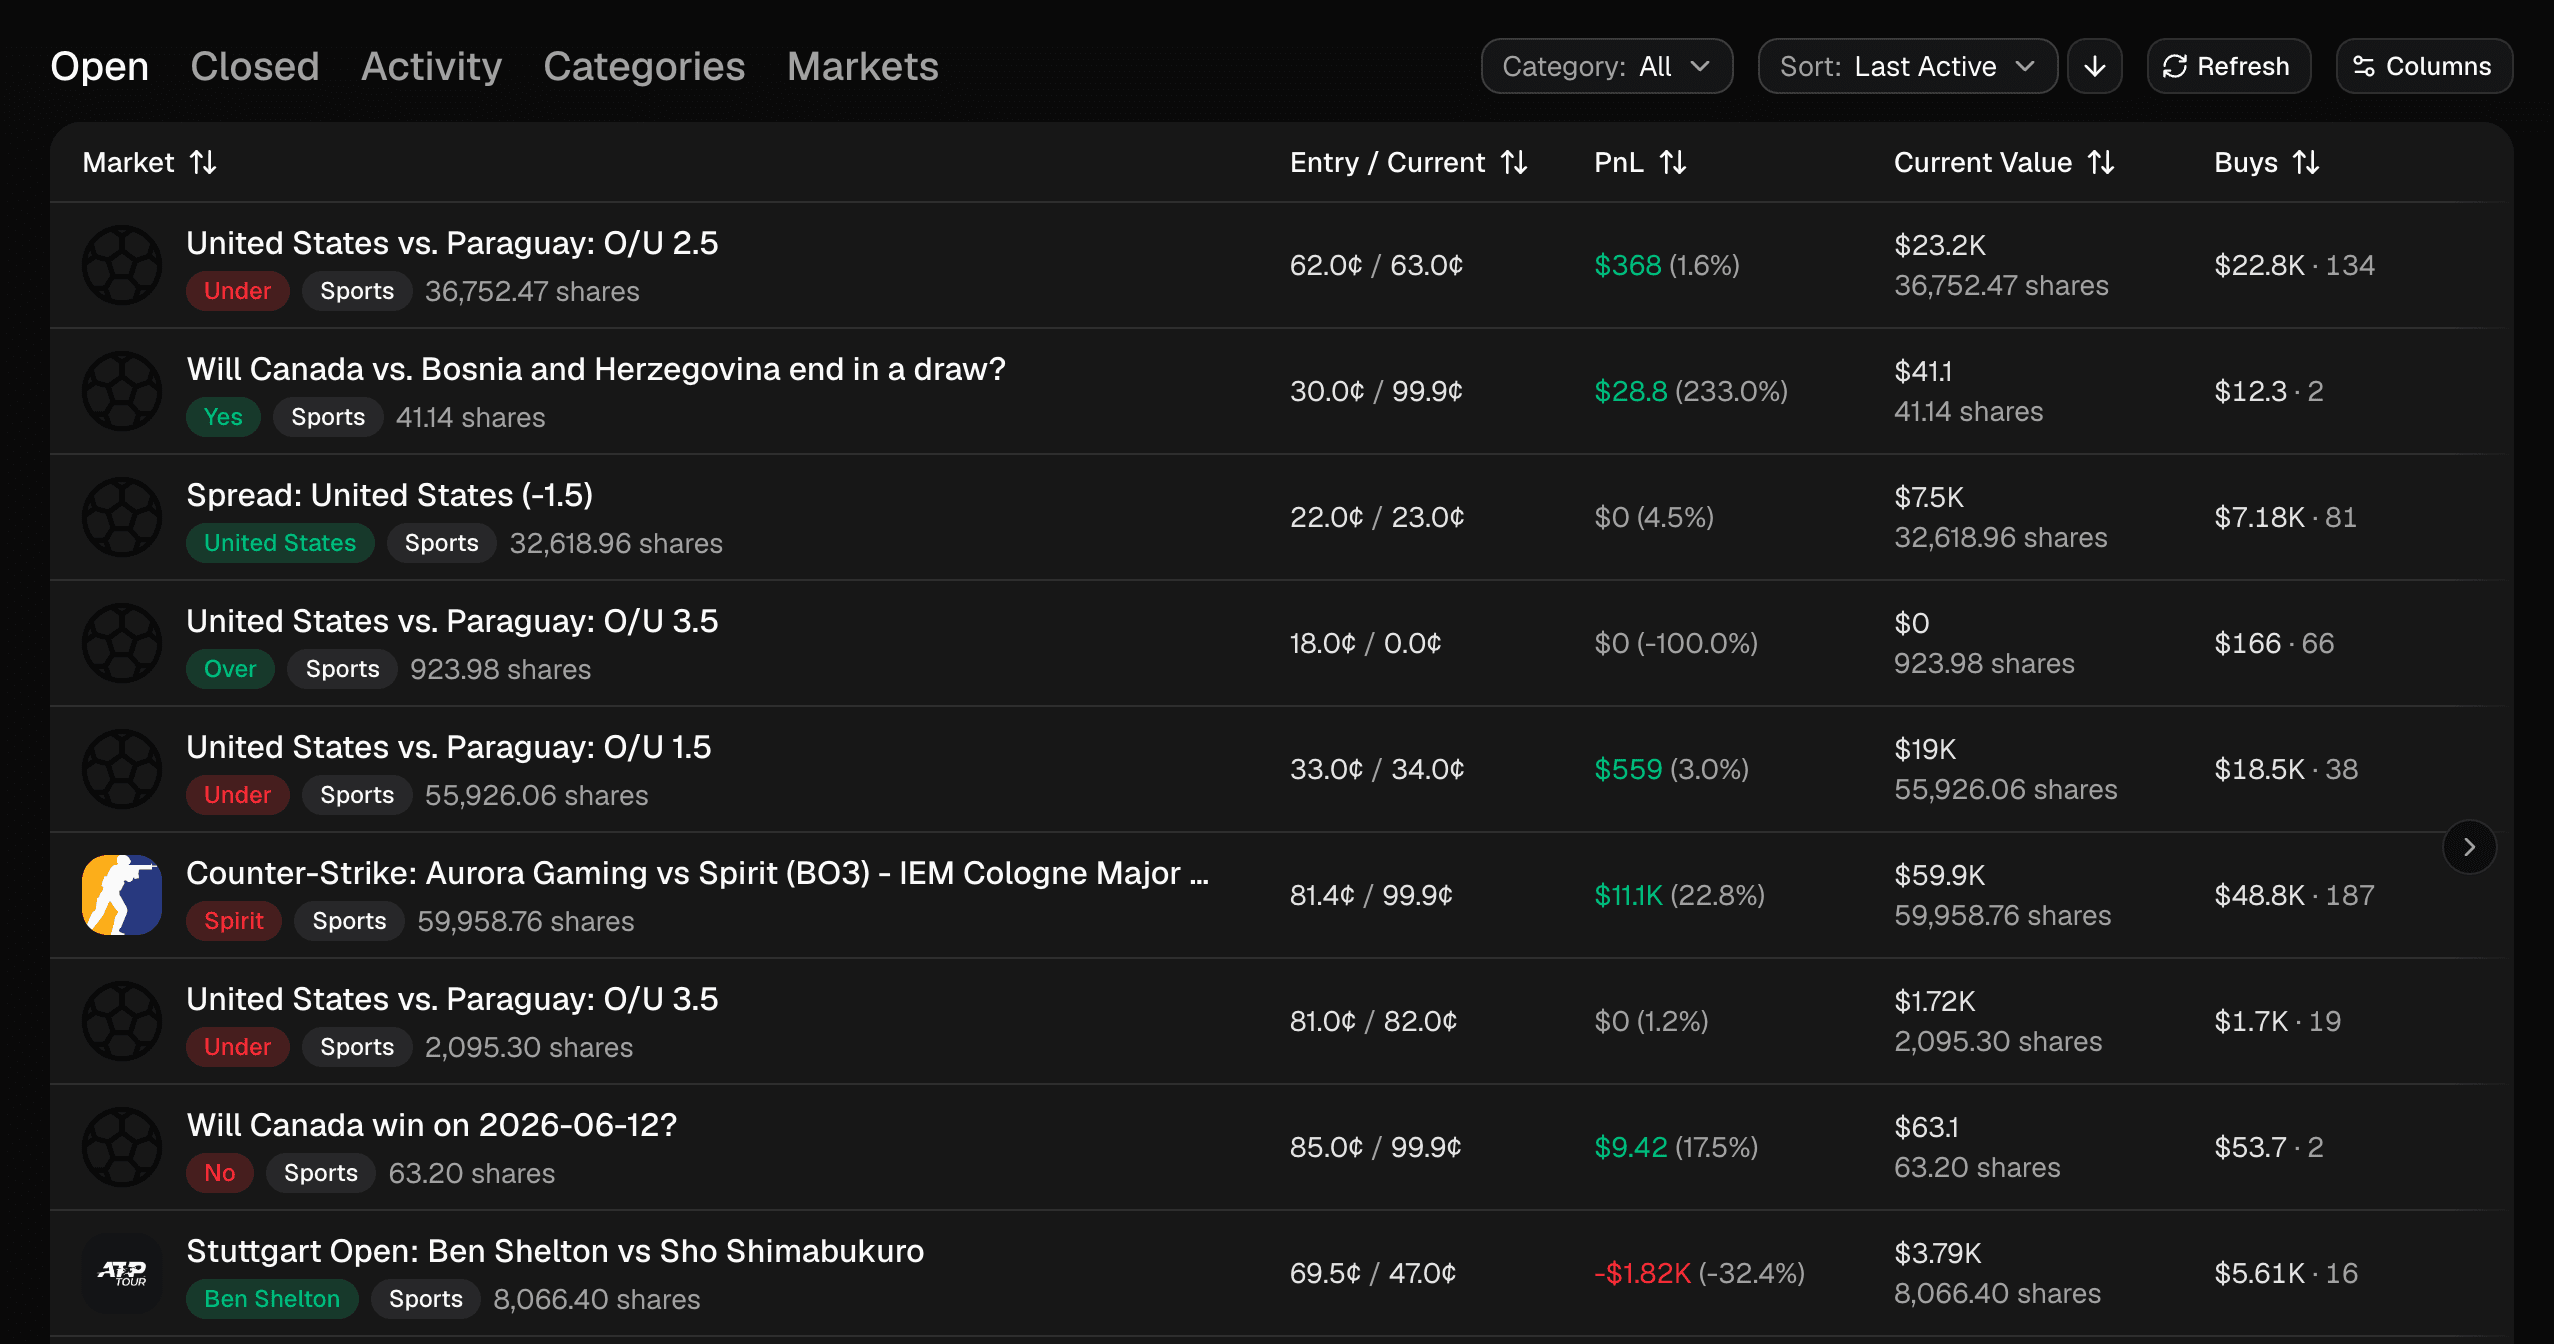
Browse these positions on Struct Explorer →
- Summary (
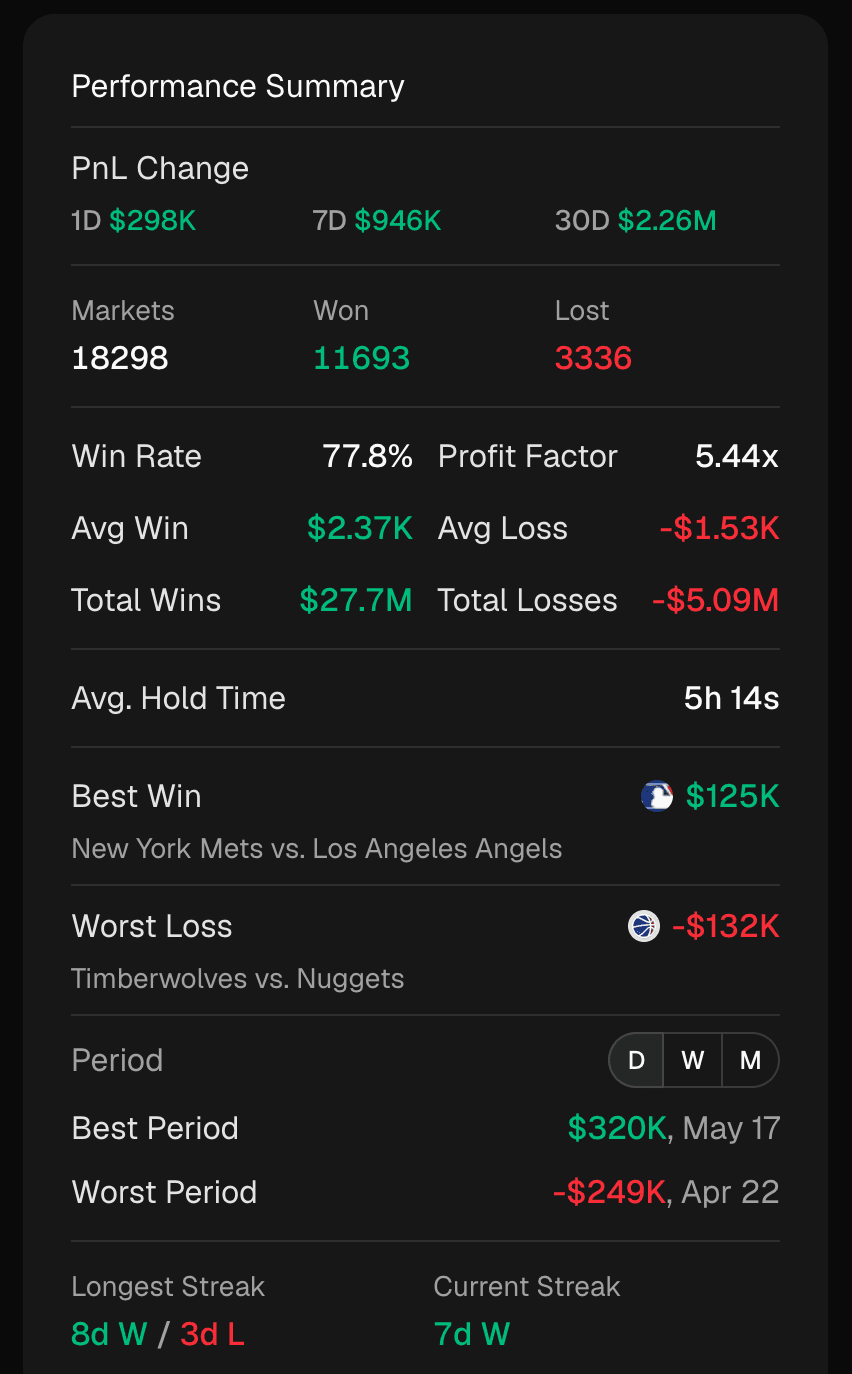
/trader/pnl/{address}): the headline number. Realized PnL, open-position value, total volume, win rate, profit factor, avg win, avg loss, best and worst trade (with metadata), avg hold time, market-level wins/losses, total fees, and a full breakdown of merges, splits, conversions, redemptions, rebates, rewards, and yield. Everything you'd need to render a trader profile in a single request. - PnL candles (
/pnl/{address}/candles): OHLC bars for total PnL and portfolio value, configurable resolution. Each bar is tagged with its opening and closing block. You can render a trader's performance the same way you'd render a price chart, candle for candle. - Position exits (
/pnl/{address}/exits): every point where a trader closed out, sized and labelled for overlay directly on the PnL chart. Each marker carries its exit time and block, realized PnL in dollars and percent, market category, and areason(resolved_win,resolved_loss,sold_win,sold_loss) so you can color or filter the dots. Filter by reason or category, sort by exit time, PnL, or cost basis, and drop the markers straight onto the candles from/pnl/{address}/candlesto show exactly where each win and loss landed. - Period extremes (
/pnl/{address}/periods): best and worst day, week, and month for both PnL and portfolio value, across any timeframe. - Period-over-period changes (
/pnl/{address}/changes): one call returns the latest snapshot plus per-window change values for every standard timeframe. Drop straight into a "PnL: +$1,240 (24h)" UI without doing your own math. - Risk (
/pnl/{address}/risk): max drawdown, current drawdown, and max runup, each tagged with the specific market that caused it. High, low, and latest across the chosen window. The kind of view you'd build for a portfolio dashboard, served as one call. - Trader breakdowns (
/positions,/markets,/events,/categories): every tab of a trader profile, served from one namespace./positionstakes a requiredstatus=open|closedfilter and returns paginated entries with current price, current shares balance, average entry and exit price, realized PnL, percent return, andredeemable/mergeableflags. It's the exact dataset behind "Open positions" and "Closed positions" tables./markets,/events, and/categoriesaggregate that same activity one level up, so the same trader profile page can also show "Markets traded," "Events traded," and "Category performance" with no extra calls or client-side rollups. Filter bycondition_id,market_slug,position_id, search by title, or sort by any metric in the response.
See the full summary on Struct Explorer →
Leaderboards and top traders
Five endpoints rank traders by PnL, each at a different scope:
- Global (
/trader/global_pnl): every tracked trader on Polymarket, sorted by any metric. - Events (
/events/top-traders): top traders inside a specific event. - Markets (
/market/top-traders): top traders inside a single market. - Market positions (
/market/position/top-traders): top traders holding a specific outcome. - Tags (
/tags/top-traders): top traders across every market with a given tag (e.g. "Crypto", "Politics", "Sports").
Same fields, same sort options, same pagination, regardless of scope. Pick a slice of Polymarket and get the traders making (or losing) the most money inside it.
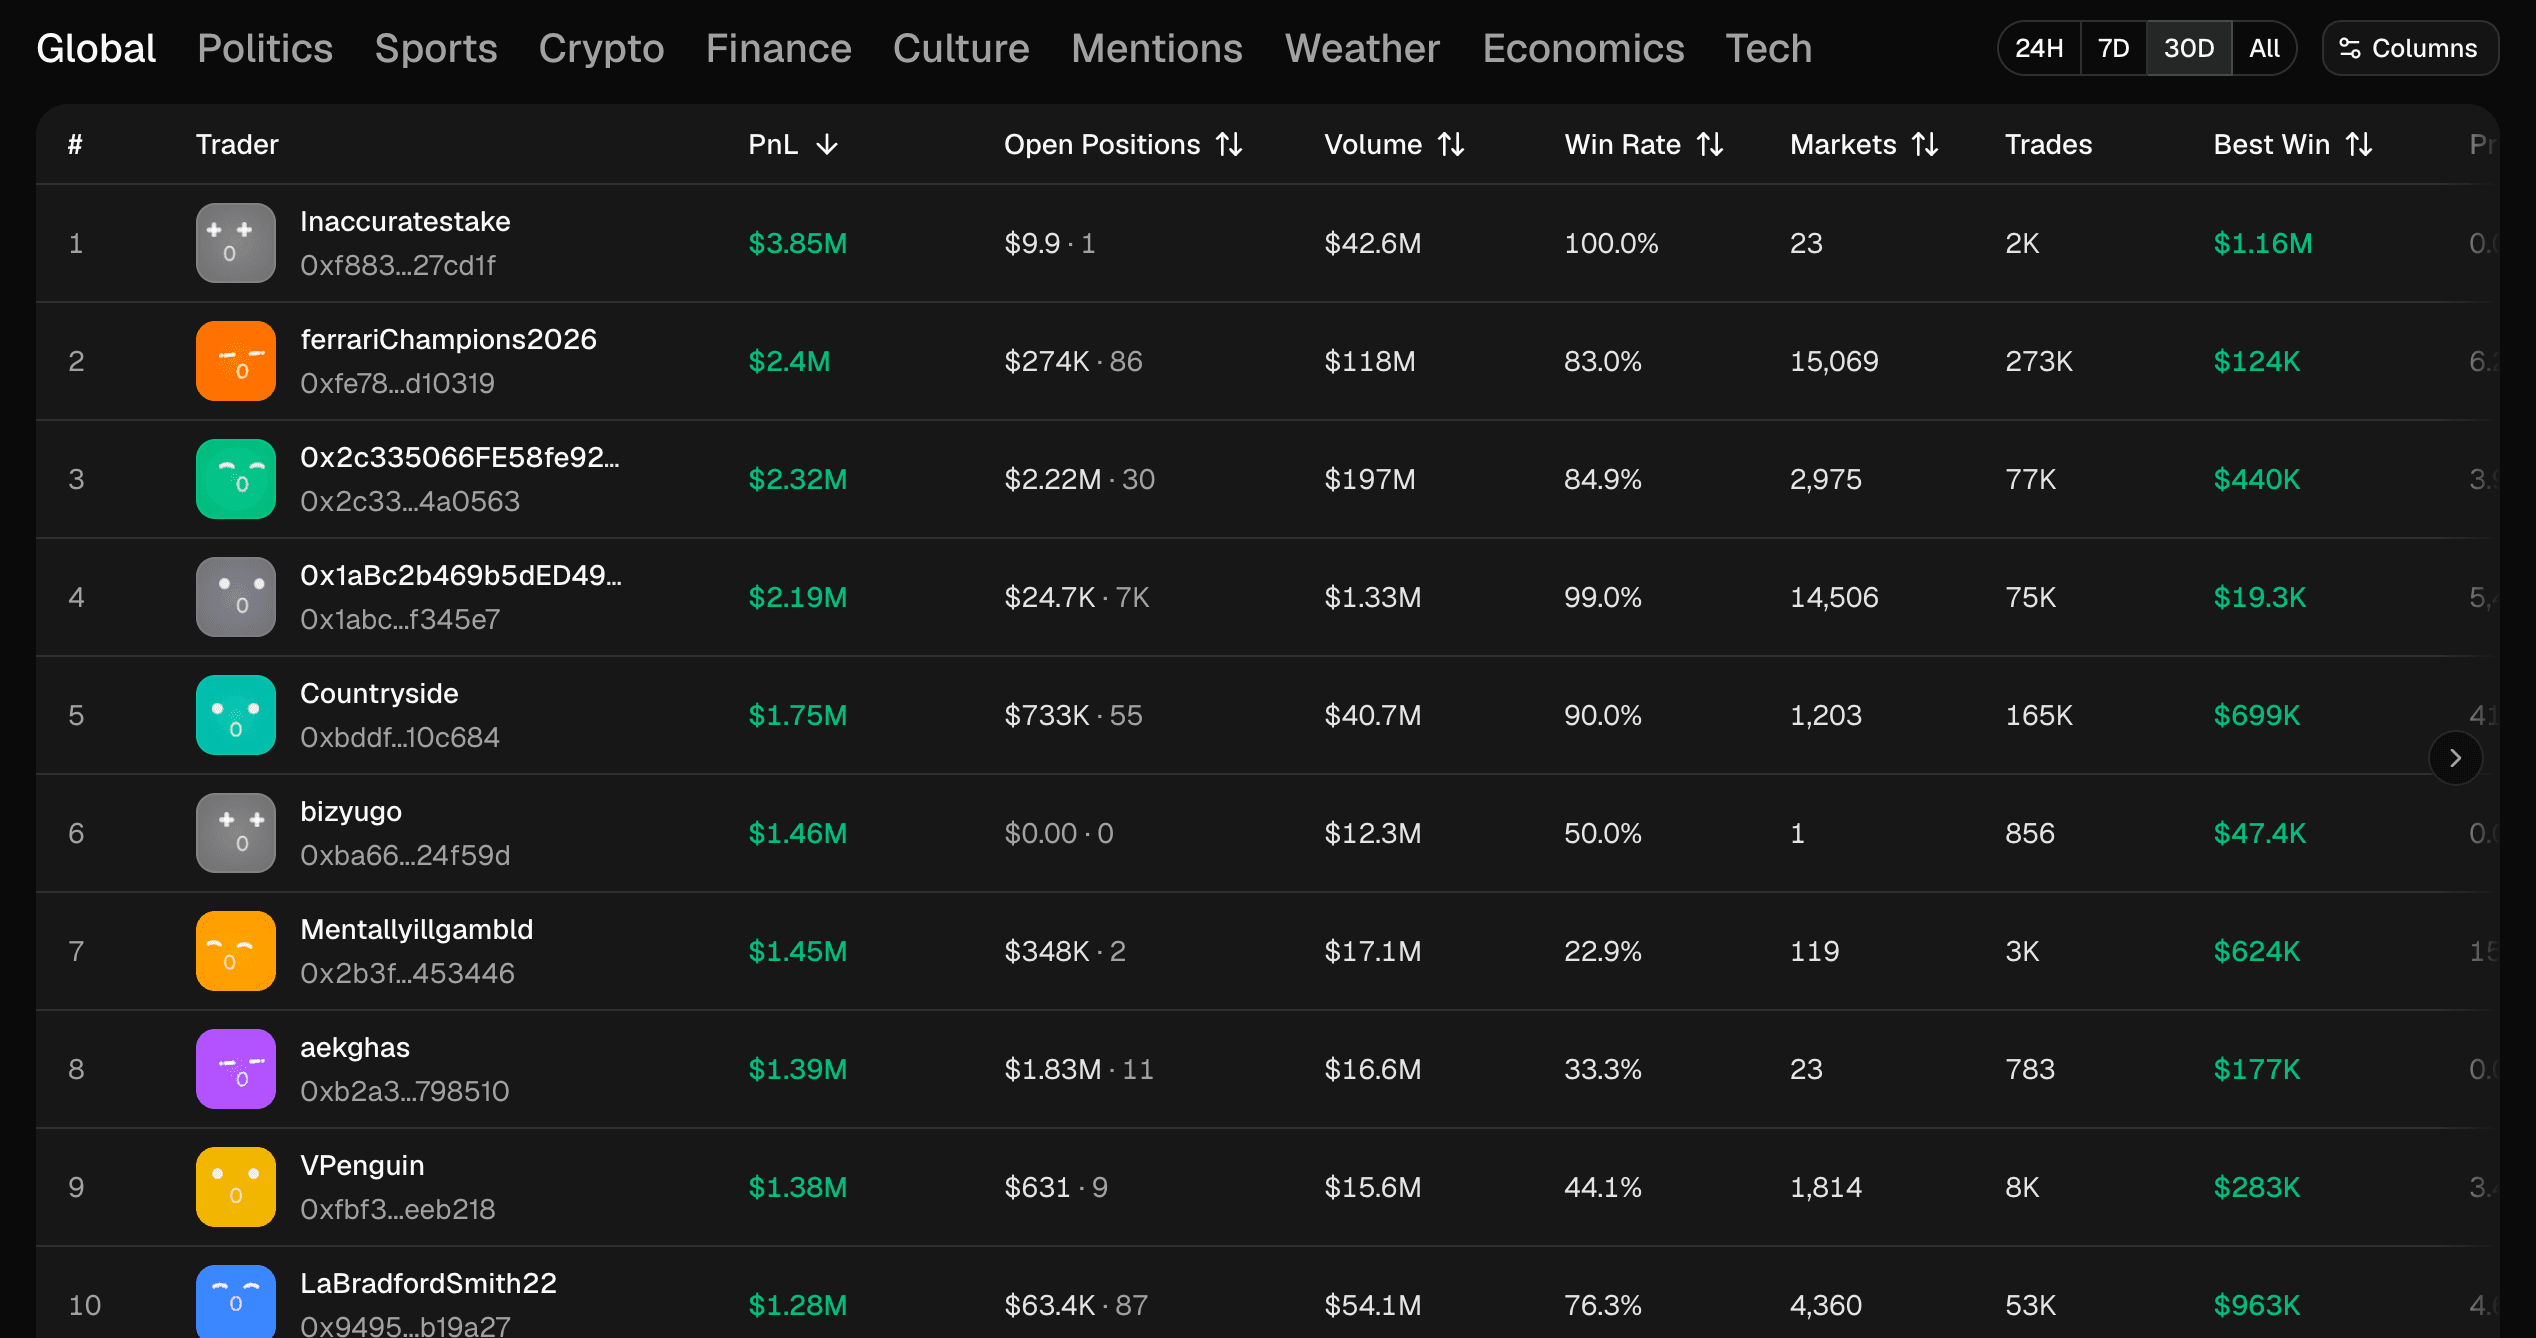
Open the live leaderboard on Struct Explorer →
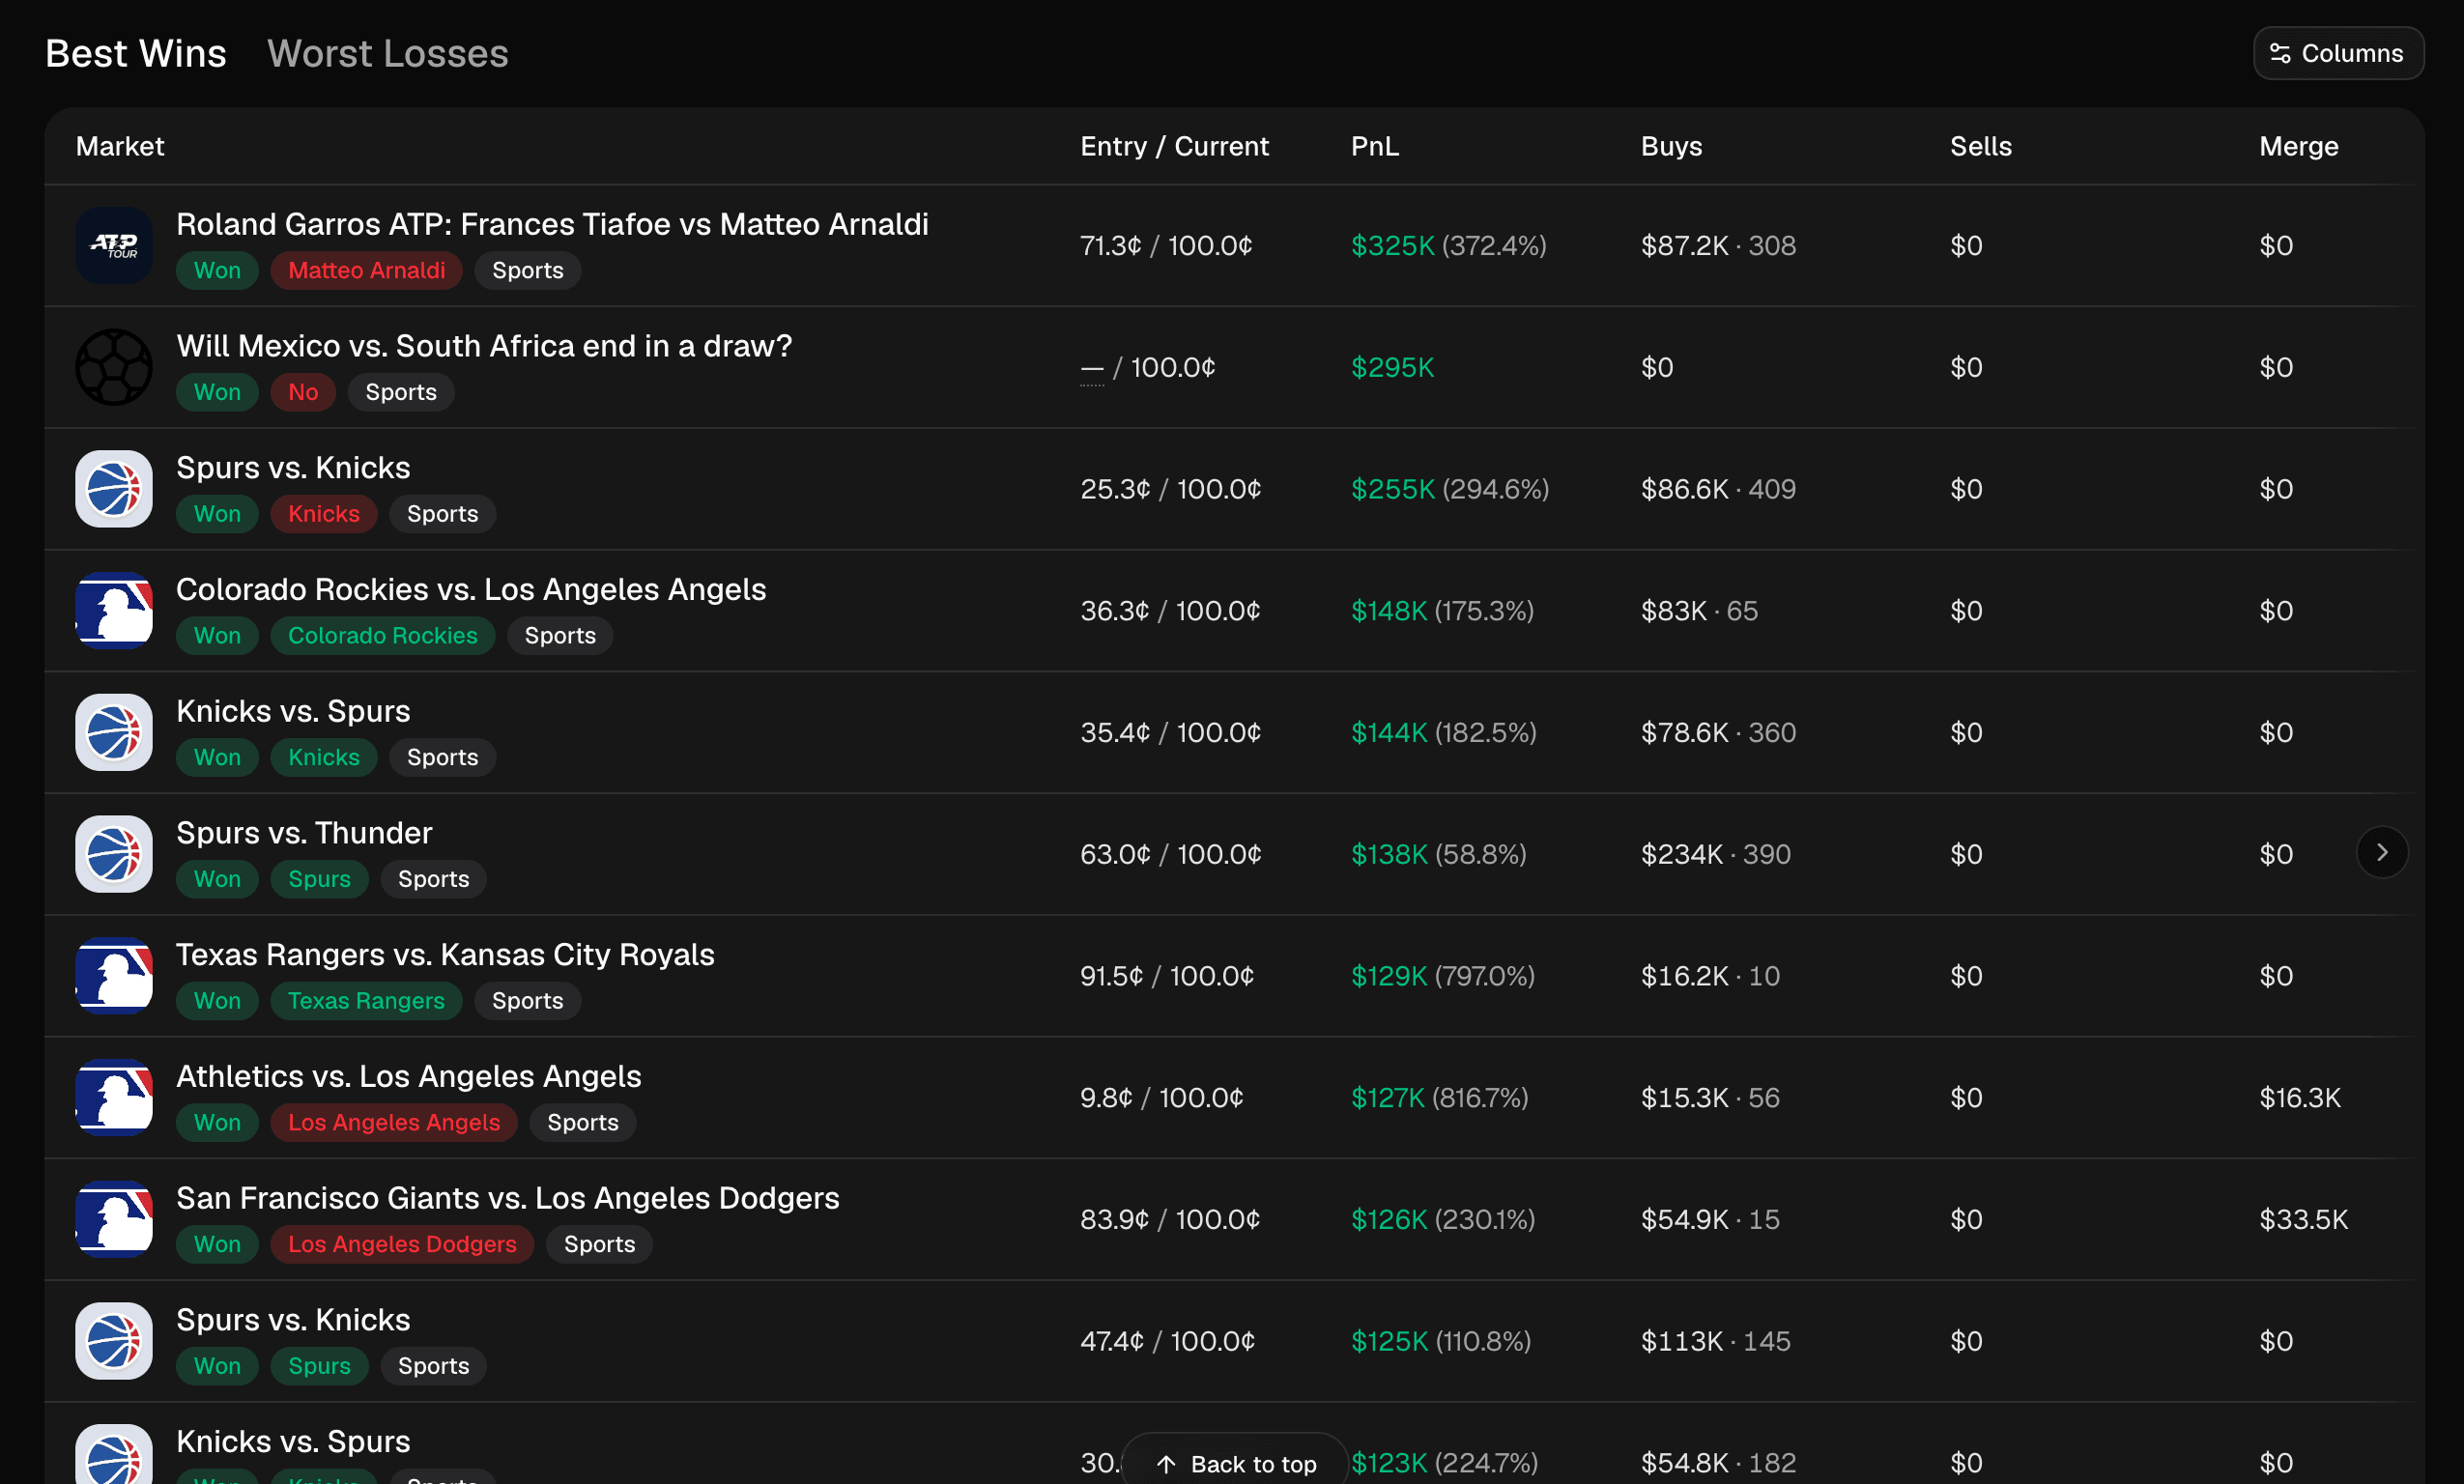
Biggest wins
/trader/top_trades_markets ranks every market on Polymarket by aggregate realized PnL across all traders, with a configurable timeframe (1d, 7d, 30d, or lifetime) and any sort metric on the MarketEntry shape. It's the "where is the money actually being made" view: a one-call answer to "which markets produced the biggest wins this week," "where was the most volume yesterday," or "which markets have generated the most aggregate profit ever."
Top holders
Live top-holder lists for any market or position, refreshed the moment a new block lands. Pass include_pnl=true and every holder comes back with their full PnL breakdown: realized PnL in USD, percent return, average entry and exit price, redemption and merge proceeds, fees paid, first and last trade timestamps, and a redeemable flag that fires when a resolved position can be redeemed. Holder-count time series is also exposed at the event, market, and position level, so you can track how a position's holder base grows or contracts over time.
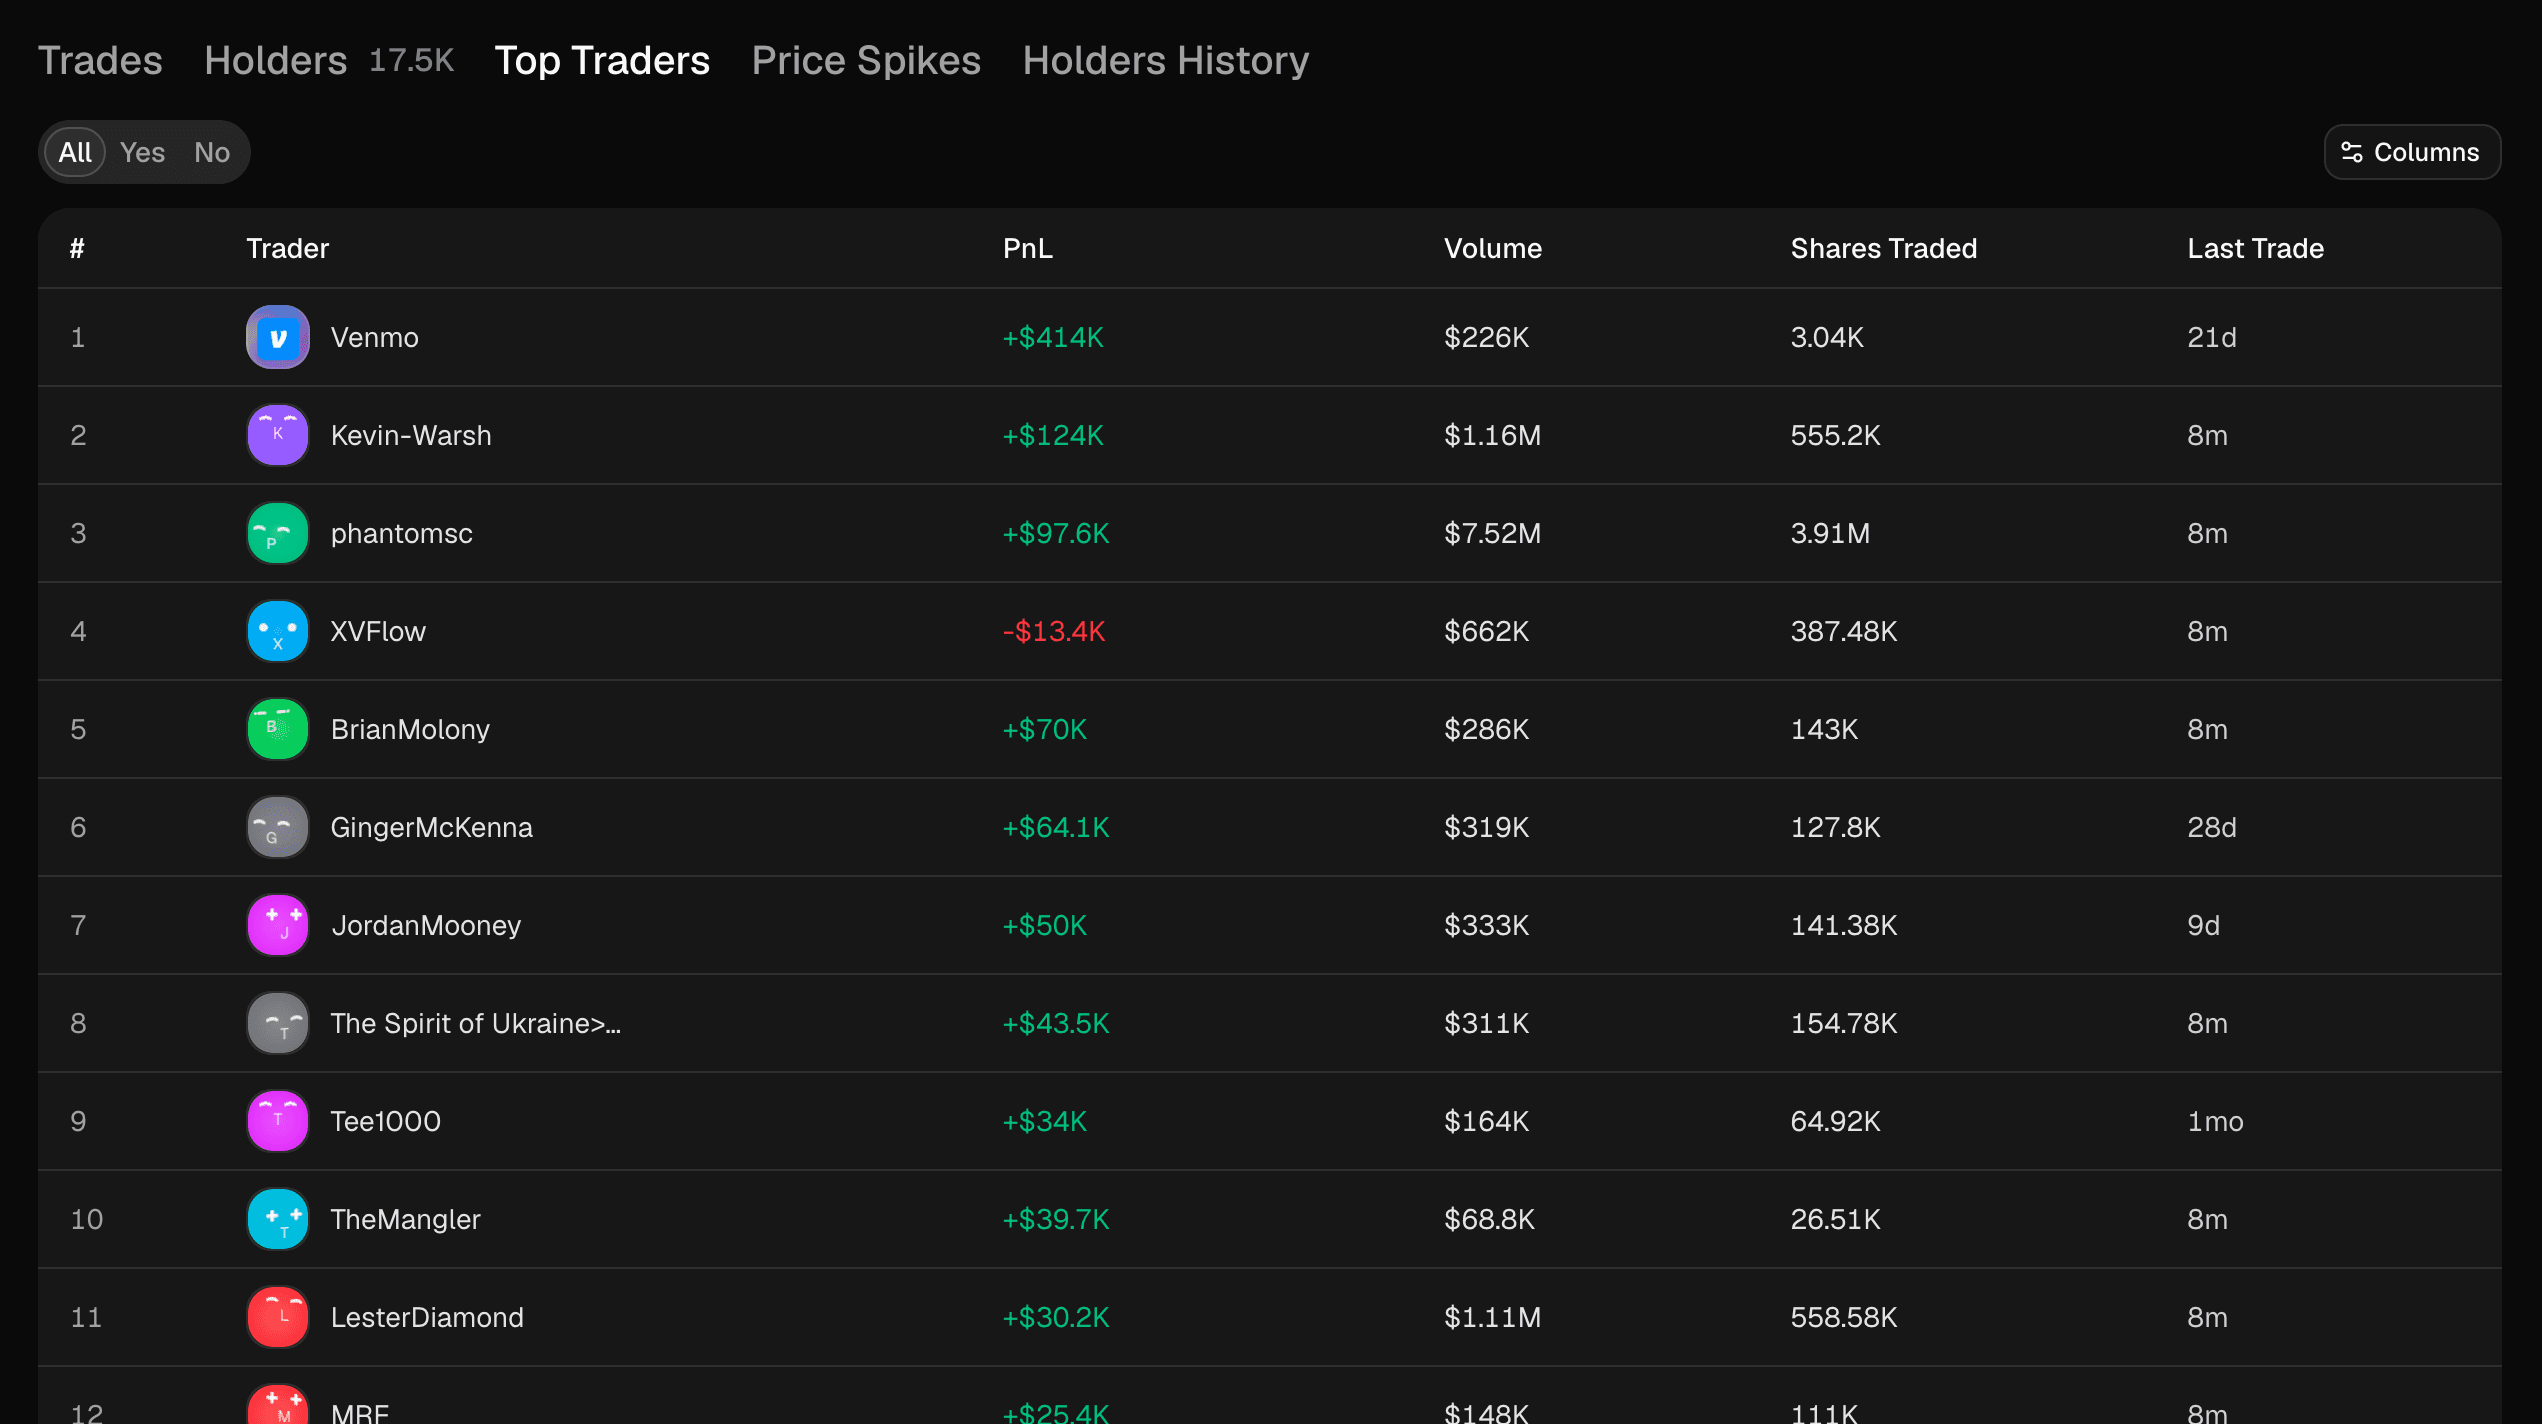
See this market's top traders on Struct Explorer →
Schema design
The per-trader drill-down endpoints and the top-trader leaderboard endpoints return the same {Category,Event,Market,Position}Entry shapes. The only difference is perspective: one trader across many markets, or one market across many traders. Same fields, same sort options, same pagination.
Explore this breakdown on Struct Explorer →
Real-time PnL, over WebSocket
The same v3 numbers are also pushed live, typically within 50ms of block confirmation. Subscribe to polymarket_trader_pnl with one or more wallet addresses and you can watch a trader's position values, portfolio balance, and PnL move in real time as prices shift on-chain, no polling required.
Four PnL granularities are exposed and can be subscribed to independently:
- Global: portfolio-level PnL for the trader, including 1d / 7d / 30d / lifetime windows in a single payload.
- Market: per-market PnL for the trader.
- Event: per-event PnL.
- Category: per-category PnL.
Choose what wakes you up
The stream is designed to match what your application actually cares about. You control the trigger:
- Price-driven updates: payloads re-emit every time mark-to-market value moves with the underlying price. Right for live dashboards, portfolio tickers, and anything that should re-render as the order book moves.
- Trade-driven updates only: filter out pure price-move noise and only receive a payload when the trader actually buys, sells, merges, splits, redeems, or converts. Right for execution bots and notification systems that don't care about untriggered fluctuations.
- Window-rollover updates: opt in or out of payloads that fire when a timeframe window rolls (e.g. a new 1d period starts). Useful for "PnL since open" UIs; safe to disable if you don't care.
Position-level rooms
For per-position reactivity, two more rooms cover the lifecycle directly:
polymarket_trader_positionspushes atrader_position_lifetime_updateevery time a tracked trader's position PnL changes. Useful for live dashboards or trader-facing UIs that need to reflect price moves the instant they happen.polymarket_trader_position_resolvedfires once when a position resolves, withwon: true | falseand the final realized PnL.
Position-tracking bots, copy-trading systems, and live leaderboards no longer need to poll. Open one socket, get the numbers as they change.
Explorer is updated
Every surface on explorer.struct.to/traders now reflects v3. Trader profiles, leaderboards, market holder views, and PnL charts are all running on the new calculation.
If you've looked at a trader's profile before and been confused by the numbers, open it again. It should make more sense now.
Start Building
v0.6 is live now. The TypeScript SDK is on npm, the API is live in production, and full docs are up.
Get started at struct.to/dashboard
Explore live trader data at explorer.struct.to/traders
Read the PnL v3 docs
Install the TypeScript SDK